Spokes v1.3.8
Published at September 7, 2022 · 4 min read
Share on:Today we’re publishing the packages and container images for the v1.3.8 update to Spokes. This release includes many small bug fixes and the addition of new features like tracking and visualization for the events and life-cycle for a tunnel.
You can find the updates on downloads page, Docker Hub and our RPM repository.
This release provides many quality of life improvements and fixes that we’ll describe below.
Finally, we’ve split the database into three (since we use SQLite). The primary database is still spokes.db which is located in /var/lib/spokes. We’ve created two new database files for the connection metrics and tunnel events. These files are named spokes-metrics.db and spokes-events.db.
The metrics and events database will grow more quickly in size and causes write-locking that delays operations on the primary tables, which are quite small. This should improvement performance and resolve some database timeouts that users reported to us.
In addition, we are now using the write-ahead logging feature in SQLite which should reduce latency when reading and writing from the databases.
Debug Logging
Our existing logging was a flood of everything, including debug information. We’ve enable a log level filtering so that only warning and critcal errors are sent to the log file by default. These settings can be toggled in the configuration file or the dashboard.
To enable via the configuration just add the debug property and set it to true. You’ll need to make the edits as the spokes user, e.g. sudo -u spokes vim /etc/spokes/config.json
{
	"debug": true
}
Then restart the Spokes service to realize the configuration file changes.
[user@host ] sudo systemctl restart spokes
You can change the log level dynamically using the dashboard and visiting the Configuration section. Just select the Debug tab and change the level to the default level or set for debugging and tracing if you want all information sent to the log file.
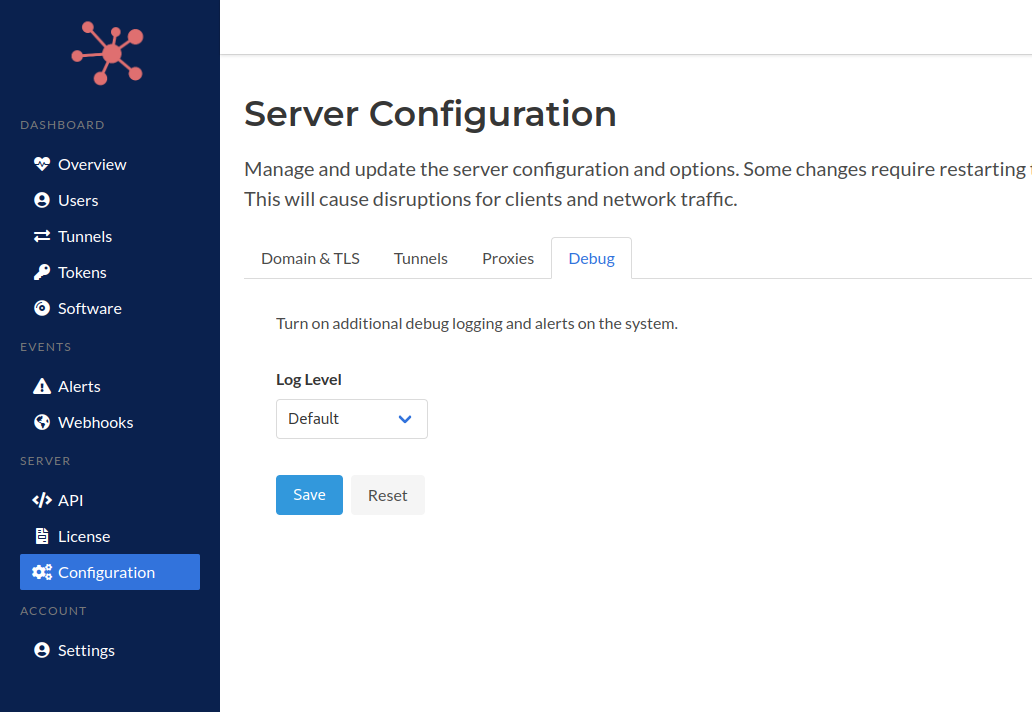
Debug Log Configuration
The later setting will send all information or debug messages to the log file. Logging is sent to standard out which means that they’re visit using journalctl when Spokes is run as a systemd service or using the docker logs command when it’s deployed as a container.
Service Availability
We’ve fixed some bugs in our service availability checks when they were to set to one minute or lower.
One minute is the new minimum value and now an icon is included in the tunnel details page to indicate if the upstream service served behind a tunnel are available.
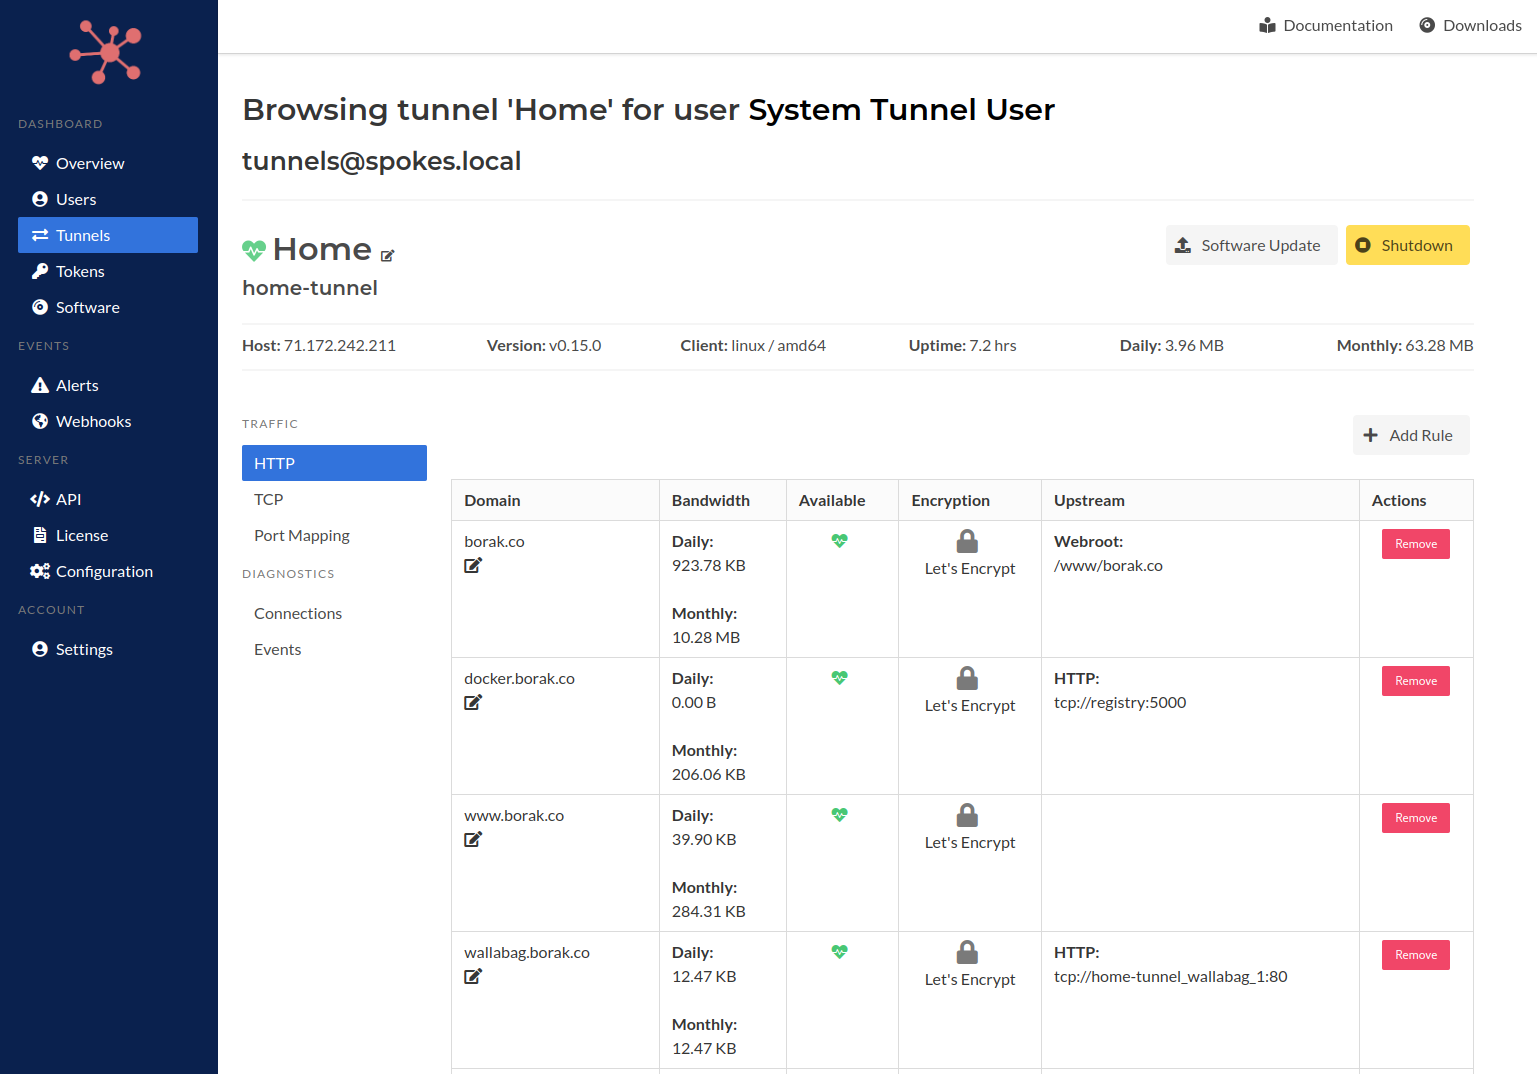
Service Availability Icons
When an upstream service is available a green heart icon will be displayed. When it’s unavailable or down, the icon turn grey.
Tunnel Event Tracking
Diagnosing why a service hosted behind can be challenging. The improved visualization of upstream service availability helps with debugging, but we’ve also added more events related to a tunnel that we stored and are now available in the detailed tunnel view.
There is a new sub-section in tunnel details page called Events. Visit this area to see a variety of events associated to a tunnel. These include:
- Login and new session
- Terminating prior session due to a login
- Terminating a stale session, e.g. keep-alive expired
- Upstream services going up/down
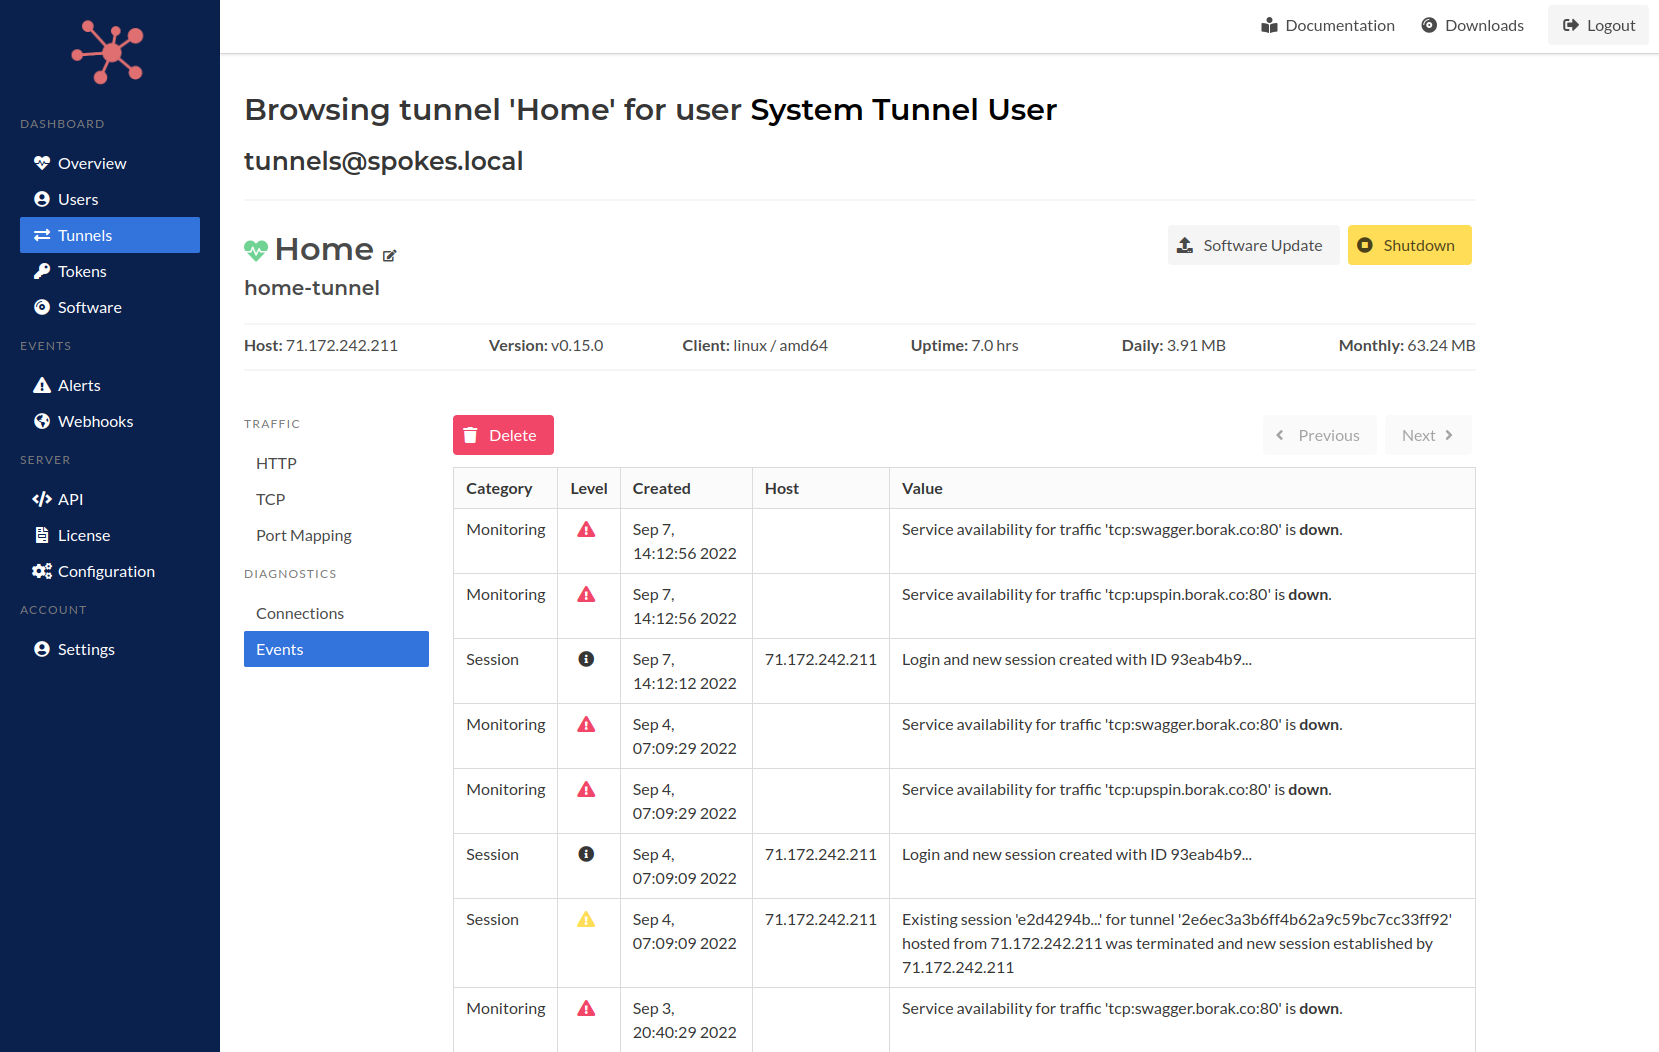
Tunnel Event Tracking
We will be continuing to add more events life-cycle tracing for tunnels to make it easier to dianogse connectivity issues for the services hosted behind the tunnels and the tunnels themselves.
Aggregated Alerts
We’ve updated the Alerts page to filter what kinds of tunnel events or alerts are visible here. Critical events such as upstream services going down/up are recorded here. In addition, any event that can be considered a warning is stored as well, such as collisions for network traffic.
In this example two tunnels may be requesting the same traffic which might indicate an error in configuration.
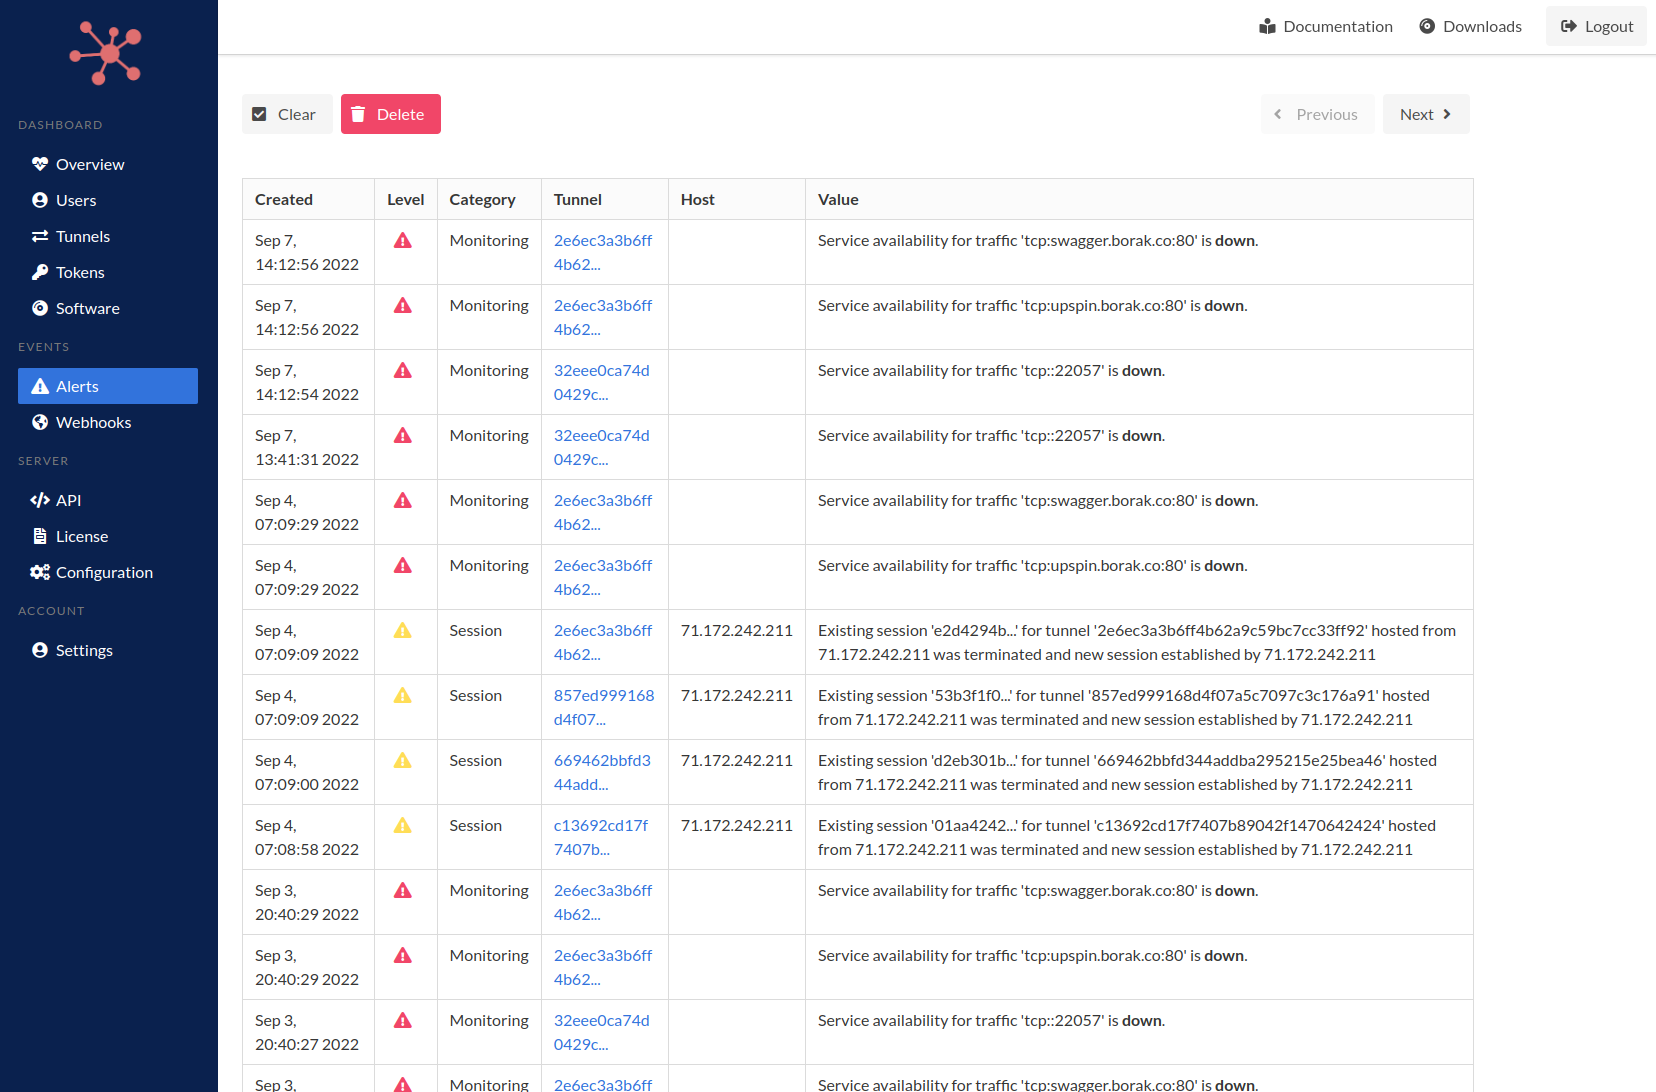
Updated Alert View
Alerts can be cleared, which means that they’ve been acknowledged by an administrator. Admins can also delete alerts as well, however, this action would delete all tunnel events captured and stored by the system.
Up Next!
We are working on a new website focused on Spokes and related software. An updated client for Packetriot is in the works. This update is more of a software redesign but will allow us to tailor clients for Spokes and Packetriot.
I’ve begun working on support for UDP tunneling and will provide support for that by the years (hopefully).
Let us know if we can focus on any other new features or improvements, cheers!